Intercounty Connector, Maryland
Case Study Introduction
Project Overview
The Intercounty Connector (ICC) is an 18 mile east-west limited
access highway between I-270/I-370 and I-95/US 1 in Montgomery
County and Prince George's County in Maryland. The ICC has been
included in master plans for Montgomery County and Prince George's
County for over 50 years. The National Capitol Planning Commission
(NCPC) first introduced the concept of an east-west highway in the
1950s as part of a larger outer beltway around Washington, DC. The
outer beltway was later dropped, but the segment between I-270 and
I-95/US 1, which became known as the ICC, was retained to address a
need for improved east/west mobility between those two north/south
corridors. In 1972, the Montgomery County Planning Board
recommended, and the Montgomery County Council approved, the
alignment of a new highway east of I-270 and north of Rockville to
the eastern border of Montgomery County.
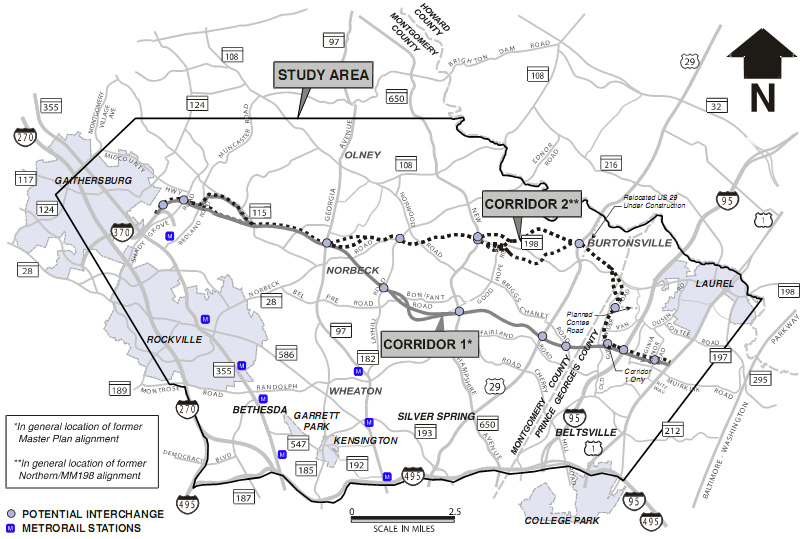
Figure 1: Map of Intercounty Connector Study Area
Maryland State Highway Administration (Maryland SHA) started the
first National Environmental Policy Act (NEPA) analysis of an ICC
in 1979, and published a Draft Environmental Impact Statement
(DEIS) on July 8, 1983. Later in the 1980s, several Federal
reviewing agencies expressed concern about the impacts on the
natural environment. Additionally, Maryland SHA became concerned
that much of the socioeconomic data and traffic forecasts, upon
which the need and design of the ICC were based, had become
outdated since preparation of the 1983 DEIS. Maryland SHA initiated
a new ICC planning study in 1991 and published a new DEIS on March
3, 1997, but no final decisions were made on the study.
Maryland SHA and the other lead agencies restarted planning
efforts in 2004, when the project was identified as a high priority
for the state by the Governor. The project’s purpose and need
was based on a combination of existing and future needs. Population
in the area had grown by 28% over the past two decades and was
expected to continue to grow, leading to a projected 29% growth in
ADT in the study area by 2030. Maryland SHA also identified a need
for a connection between the two north/south corridors of I-95/US 1
and I-270 that are the most intensive employment, residential and
transportation corridors in Maryland. A DEIS was published in
November 2004. The FEIS was signed on January 3rd, 2006,
and the Record of Decision on May 29th 2006.
A subsequent legal challenge to the project focused on a number
of issues, including traffic modeling and analyses. Among the
issues of contention were the measures of effectiveness used to
evaluate alternatives and the choices made in the land use
forecasts used in the model. While reviewing this case study, the
reader should note the effort made to identify the measures of
effectiveness prior to modeling of alternatives so as not to
prejudice the outcome and the sensitivity analyses that were
conducted to review the effect that new land use forecasts would
have on the project. Based in part on the efforts in these areas,
the court decided in favor of the project sponsors.
Travel Forecasting Summary
Maryland SHA used the Metropolitan Washington Council of
Government (MWCOG) Transportation Planning Board (TPB) travel
forecasting model as a basis for developing a travel forecasting
model specifically for the ICC project. TPB is the designated
Metropolitan Planning Organization (MPO) for the local government
jurisdictions of the three-state Metropolitan Washington area.
Maryland SHA selected 2030 as the forecast year for the ICC
study. The modeled highway facilities included the planned
improvements in the Fiscal Year 2003 Constrained Long Range Plan
(FY 03 CLRP) for construction through 2030. The modeled transit
service included all services in the FY 03 CLRP, express bus routes
on the ICC, and feeder routes to support the express service.
Maryland SHA used the 2030 Round 6.3 Cooperative land use
forecasts, which were the latest socioeconomic data approved by
MWCOG for the Metropolitan Washington area for all
alternatives.
Case Study Illustration of the Guidance
The ICC project provides good illustrations of five of the seven
key considerations contained in FHWA’s Guidance on the
Application of Travel and Land Use Forecasting in NEPA. The MPO and
project sponsors had a tight, collaborative relationship on the ICC
study. This relationship resulted in the MPO adopting an update to
the regional model that incorporated refinements that were made to
the regional model as part of the ICC forecasting effort, ensuring
consistency between the project-level and regional traffic data.
Extensive effort was applied to planning the modeling effort,
including defining a wide study area to prevent the need to later
extend it, and preparing memoranda that proposed model runs and
documented assumptions prior to conducting the model run. This case
study emphasizes the following considerations from the guidance: 1.
Project Conditions and the Forecasting Needs of the Study; 2.
Suitability of Modeling Methods, Tools, and Underlying Data; 4.
Forecasting in the Alternatives Analysis; 5. Project Management
Considerations, and 7. Documenting and Archiving Forecast
Analyses.
Key Consideration 1 of the Guidance: Project Conditions and
Forecasting Needs
Establishment of Forecasting Analysis
Requirements
The size of the study area and the measures of effectiveness
were both considerations addressed at the beginning of the study,
prior to any modeling efforts. The size of the study area was
intended to be sufficiently large as to avoid the need to revise
the model later in the project. The ICC study area extended beyond
the immediate corridor eventually selected for the ICC. It included
the major highways adjacent to the corridor that would likely be
most affected by the ICC: I-270 from Gaithersburg, MD to I-495,
I-495 from I-270 to US-1, and I-95 and US-1 from Laurel, MD to
I-495.
The introduction to the forecasting methodology section of the
study documentation explains that “New facilities are usually
justified not only based on existing travel patterns, but also
based on future patterns that result from changes in population and
employment. The design year for a new facility is usually at least
20 to 30 years in the future. Year 2030 travel patterns for the ICC
EIS were developed using the Metropolitan Washington Council of
Governments (MWCOG) Transportation Planning Board (TPB) travel
forecasting model.” The region covered by MWCOG (and the TPB
model) includes all of Montgomery and Prince George counties, but
not Howard or Anne Arundel counties. The edge of the study area
selected for the project is partially formed by the border of the
MWCOG region, but was sufficiently large to allow analysis of
transportation, air quality, and noise impacts in the EIS. The
traffic analysis zones (the basic geographic area to and from which
trips are analyzed) in the TPB model were retained and not further
refined for project-level studies.
Measures of effectiveness were also defined at the beginning of
the study and tied into the likely purpose and need elements of the
project. The need for the ICC is described in terms of both current
deficiencies in the transportation network in the study area and
the long term impacts that anticipated growth in the study area
will have on the transportation network. The ICC’s Purpose
and Need chapter states that the “this transportation project
is intended… to provide cost effective transportation
infrastructure to serve existing and future development patterns
reflecting local land use planning objectives.” The chapter
introduces several project needs, including “Community
Mobility and Safety” and “Movement of Goods and People
to and From Economic Centers.” The Purpose and Need chapter
also highlights the lack of east-west highway routes, which has led
to congestion and high accident rates on the local road system, and
frames the need for an east-west highway to accommodate traffic
generated by economic development areas so that economic growth is
not hindered.
The ICC’s Purpose and Need chapter discusses (in both
qualitative and quantitative terms) the current and anticipated
travel demand in the corridor. It describes:
- The existing and planned transportation network,
including a discussion of the traffic conditions on and the
shortcomings of major roads in the study area.
- The existing and future (no-action 2030) traffic volumes
at six screenlines across the study area.
- The existing and future (no-action 2030) levels of
service at 51 key intersections in the study area.
Key Consideration 2 of the Guidance: The Suitability of
Modeling Methods, Tools, and Underlying Data
Appendix F to the ICC Travel Analysis Technical Report
provides detailed memorandums discussing improvements to the
regional travel model to support testing of highway tolls;
validation of the regional travel model in the ICC corridor that
led to adjustments in land use inputs, speed and capacity
parameters, k-factors in the trip distribution model, and network
updates; a peer review of the regional travel model by a
Transportation Research Board panel; and a proposed work plan to
improve the regional travel model based on the findings of the peer
review.
Calibration, Validation, and Reasonableness Checking of
Travel Models
The calibration and validation of Version 2.1C of MWCOG’s
model is described in the ICC Travel Analysis Technical Report. The
Travel Analysis Technical Report describes the validation of the
model for the ICC study area. The report describes a sequence of
validation tests that were used to validate the ICC travel demand
model. In summary, these involved reviewing the regional
model’s performance in the study area, which led to the
observation that the regional model somewhat over-simulated travel
region-wide as well as within in the ICC corridor.
Next, the project modelers applied updated land use inputs as
well as model and network refinements to improve the modeling
process at both the regional and corridor levels. Each change was
evaluated by examining the performance of such characteristics as
regional and corridor vehicle trips, vehicle miles traveled, and
screenline results. Specific adjustments included:
- Land Use: The land use inputs for the project were
brought up to date to include the Round 6.3 Cooperative Forecasts.
Even with the refined land use inputs, however, travel to and
through the ICC corridor remained substantially over-simulated in
comparison to traffic counts.
- Speeds and capacities: Updates were made to speeds and
capacities of different facility types, based on both the Highway
Capacity Manual and data collected locally. The changes to the
speeds and capacities improved the model, but there were still
instances of over-simulated volumes on some freeways. To help
correct this, some adjustments to free flow speeds and capacities
were made to specific freeway segments in the corridor where their
observed operation characteristics deviated from the values used in
the model.
- Trip distribution: The ICC base runs indicated
over-simulation between Montgomery County and both Frederick and
Howard Counties. Additional penalties were added to the model to
reduce the over-simulation.
- Network updates: A series of network updates were made
to improve the simulation in the ICC corridor. Local agencies
reviewed the network in their area and suggested updates to the
number of lanes and routes types, and also additional facilities
that should be included in the network. A manual review of
mechanically assigned land use types for each zone, including
comparisons with aerial photos, led to a number of corrections to
facility speed and capacities (which are dependent on the density
of development in the vicinity). Further corrections were made to
be consistent with additional traffic counts that were made at many
locations in the corridor.
Consideration of Peer Review
TPB, the region’s MPO, requested the Transportation
Research Board (TRB) to convene an expert panel to review Version
2.1C of their model. This version of the model was used as the
basis of the ICC study model, so the peer review recommendations
also helped to improve the quality of the ICC modeling effort. The
TRB review panel consisted of seven members, a mix of academics and
senior practicing modelers from consultants and MPOs. The panel
worked under the following statement of task:
“This project will perform review of the state of the
practice of travel demand modeling by the Transportation Planning
Board (TPB) of the Metropolitan Washington Council of Governments.
The review panel will provide guidance on:
- The performance of the TPB’s latest travel model (version
2) in forecasting regional travel;
- The proposed process for merging the latest travel model
outputs to produce mobile source emissions;
- The TPB’s proposed direction of future travel demand
model upgrades;
- Travel survey and other data needed to accomplish future model
upgrades; and
- The detail (grain) of travel analysis zones that should be
developed for future upgrades.”
Over a two month period, the panel met for a total of three
days, with two additional teleconferences, with staff from MWCOG
and other Maryland and Virginia agencies. The panel produced two
reports documenting the findings of their review of each of the
five elements of the statement of task. TPB provided written
responses to the two letter reports and a work plan to address some
of the issues raised by the panel. The FEIS includes these letter
reports and responses, as well as lists of the reviewed documents.
The review process did not consist of detailed work with the model
files themselves, but was instead a review of summary inputs,
calibration documentation, and other documents describing mode
inputs, the model, and the post processing procedures used on model
output.
Key Consideration 4 of the Guidance: Forecasting in the
Alternatives Analysis
Overview of Transportation-related Effects and
Impacts
In the ICC FEIS, Maryland SHA presented the analysis of several
transportation related impacts that can be classified as direct
effects, including screenline analyses comparing the build and
no-build alternatives, travel times during the peak periods,
average weekday traffic volumes on local roads, estimated crashes,
and the level of service at 51 intersections in the study area.
In addition to these traditional travel performance measures,
the study team also considered several other factors that addressed
multimodal and accessibility issues. These included:
- Accessibility to jobs: Maryland SHA used the TPB model
to estimate the number of jobs accessible within a 45 minute
commute time from the study area for no-build and build
alternatives.
- Express bus service ridership: To determine the ability
of the ICC to function as a multimodal highway, the transit
components of the TPB model were used to forecast ridership for the
proposed express bus services that would use the ICC.
- Hours at capacity at study area intersections: In
addition to the measured intersection level of service in the peak
hour, Maryland SHA also estimated the length of the congested
period to identify whether the length of the peak period would be
reduced under some alternatives.
To measure indirect and cumulative effects, Maryland SHA
conducted a secondary (indirect) and cumulative effects analysis
that is included as an appendix to the FEIS and is summarized in
the main body of the FEIS. The analysis considered a timeframe from
1964 to 2030. The indirect effects that Maryland SHA considered
were induced changes in the pattern of land use, population
density, and growth rate.
Moving from Regional Model Output to a Project Level
Forecast
Post-processing for the ICC project closely followed NCHRP
Report 255, Highway Traffic Data For Urbanized Area Project
Planning And Design[1], to generate design hour turning
volumes. NCHRP 255 examines the best techniques being used in urban
areas to connect traffic modeling at the system level with project
analyses. In particular, the report discusses post-processing
techniques that are applicable to projects like the ICC.
The TPB model produced average weekday daily traffic across the
coarse network the model contained. The ICC and adjacent arterial
and interstate facilities were incorporated in the model for the
post processing effort. The NCHRP 255 procedures for smoothing link
volumes and determining average daily turning volumes were applied
using a series of Excel worksheets that were developed as tools for
this process. An iterative process was used to define cutlines that
bisected groups of parallel routes.
Once the cutlines were identified, the Excel worksheet tool was
used to refine link volumes. The tool corrected for differences
between base year model assignments and base year ground counts,
then it redistributed vehicles across the cutline. The Excel tool
not only assisted directly in the analytical effort, but also
provided file documentation of the effort.
Version 2.1C of MWCOG’s model incorporates highway pricing
to a limited capacity; since it was important to test tolling on
the ICC, it was necessary to improve the model’s sensitivity
to highway tolls. To address the potential redistribution of
traffic based on a tolling scheme, the capacity of the ICC was
adjusted. Two model runs were completed for each toll alternative
considered, a no-toll run and a toll run. The ratio of the no-toll
and toll volumes was then applied to the link capacity, which in
turn was used in the redistribution of traffic along the cutlines.
Appendix F to the ICC Travel Analysis Technical Report provides
further detail about the updates made to the model related to
tolling.
For more detail about the post processing effort, see Section II
of the ICC Travel Analysis Technical Report.
Addressing Land Development or Redistribution
Effects
Maryland SHA performed the ICC alternatives analysis using the
2030 socioeconomic forecasts adopted by MWCOG when the DEIS was
started, known as Cooperative Forecast Round 6.3. The same data was
used for the analysis of build and no-build alternatives. In
November, 2004, after the DEIS was published, MWCOG adopted updated
forecasts referred to as Round 6.4A, which utilized input from the
Expert Land Use Panel (ELUP) that had been convened to assess land
use impacts of the ICC. The ELUP estimated households and jobs
within smaller geographies of the study area (known as traffic
analysis districts) for the year 2030 for the build and no-build
alternatives. These allocations considered land use and zoning to
identify areas of potential development, as well as potential
impacts to resources and transportation facilities that would
result from the potential development.
The traffic forecasts produced with the Round 6.4A land use
forecasts assume increased growth in the ICC Study Area and showed
that there would be more development, and more traffic, if the ICC
is built than if the ICC is not built. County planners for Prince
George’s County, where growth was shown in Round 6.4A
forecasts, determined that the growth was not necessarily a direct
result of the ICC, but rather influenced by “larger
demographic and economic” factors (page IV-387 of the
FEIS).
A sensitivity analysis was completed following the DEIS to
assess the effect of different development assumptions on traffic
forecasts and determine the effect that using the latest forecast
would have on the analysis of the alternatives. As would be
expected from the inputs used in the creation of Round 6.4A
forecasts, the newer land use forecasts showed growth in the
eastern portion of the study area that would occur with the ICC,
but the ICC was shown to have the capacity to accommodate the
related increase in traffic volumes.
For additional information, see Chapter IV, Section J, of Volume
I of the FEIS.
Key Consideration 5 of the Guidance: Project Management
Considerations
Potential for Reevaluating Analysis
Version 2.1C of MWCOG’s travel demand model was used as
the basis for the ICC model, which was then validated with an
extensive set of traffic counts at 44 cutlines, resulting in
matches for 40 of the 44. The counts themselves were validated by
analyzing several years of data to identify anomalies. The peer
review panel convened for the project was used to assess the data
and process.
Following the circulation of the DEIS, MWCOG updated their model
to version 2.1D. Stakeholders questioned whether better results
would be obtained for the ICC study by adopting the 2.1D model. A
sensitivity test was performed using the same cutlines as were used
to validate the ICC model. The test found that Version 2.1D did not
provide acceptable results on 14 of the 44 cutlines. For the
cutlines where Version 2.1D did provide acceptable results, the ICC
model still presented better validation in most cases. Considering
that Version 2.1C validated better than Version 2.1D, the project
sponsors determined that the ICC model was better suited than
Version 2.1 D for use in the ICC FEIS.
Enhanced Communication between NEPA Study Team and
Forecasting Practitioners
Communication between the NEPA and travel demand forecasting
disciplines was facilitated in part through bi-weekly meetings. The
meetings included representatives from all disciplines, and an open
discussion was encouraged. The regular communication schedule and
the multi-disciplinary approach facilitated better understanding of
the relationships among the various resource and engineering
topics.
Additionally, the travel demand forecasting lead was heavily
involved in the development of the goals and objectives for the
project, the crafting of the purpose and need, and the
identification of the measures of effectiveness. This integration
of the traffic discipline into the NEPA documentation minimized the
potential for the data and performance of the alternatives to be
misinterpreted.
Key Consideration 7 of the Guidance: Documenting and Archiving
Forecast Analyses
Documenting Forecast Analyses
The travel demand forecasting effort for the ICC project was
documented in a series of technical memoranda and eventually
compiled into a Travel Analysis Technical Report. The report
identified the methodologies used, the results obtained, and was
made available online. Importantly, while the multi-volume report
contained substantial documentation in its main body, additional
details were included in a series of appendices, further
documenting the assumptions made and the results of specific
analyses such as screenline refinements, HCS link analyses, and
even the base records obtained from the MPO.
During the preparation of the FEIS and ROD, the Travel Analysis
Technical Report was updated to incorporate results of sensitivity
tests performed and the responses to stakeholder comments on the
modeling process. The updated report was also made available
online.
Significant to the documentation process was the timeliness of
the effort. Technical reports and memoranda were prepared as the
model was being refined, documenting the data sources and the
rationale for the refinements that were made. Prior to each model
run, and technical memo was circulated to other project team
members to obtain concurrence on the model run approach.
Contacts
- Mr. Nelson J. Castellanos, Division Administrator
- Federal Highway Administration
- City Crescent Building
- 10 South Howard Street, Suite 2450
- Baltimore, Maryland 21201
- Phone: (410) 962-4440
- Fax: (410) 962-4054
- Hours: 7:30 a.m. – 4:30 p.m., Monday - Friday
- Mr. Wesley Mitchell, Project Manager
- Maryland State Highway Administration
- 707 N. Calvert Street
- 3rd. Floor, Mailstop C-301
- Baltimore, MD 21202
- Phone: (410) 545-8542
- Fax: (410) 209-5004
- Hours: 8:00 – 4:30 p.m., Monday - Friday
- Mr. Dennis N. Simpson, Deputy Director
- Maryland Transportation Authority
- 2310 Broening Highway
- Baltimore, MD 21224
- Phone: (410) 537-5650
- Fax: (410) 537-5653
- Hours: 8:00 a.m. – 4:30 p.m., Monday - Friday

